Agility Desktop v2: Microsoft Excel
Let's find out what's new and improved on Agility Desktop with the latest version of Microsoft Excel - updated for Agility Desktop v2.
Quick Colour Coding and Analysis
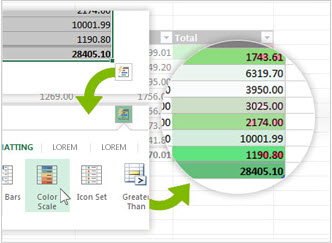
Convert data into a chart or table in two steps. Preview with conditional formatting and add colours, sparklines and you're done.
Flash Fill - fill an entire column of data in a flash
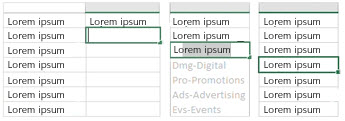
Instead of having to populate your columns one by one, Excel can recognise the patterns in the data, and as soon as it does, you can flash fill the rest of the data in one hit.
Quick Charts and Chart Recommendations
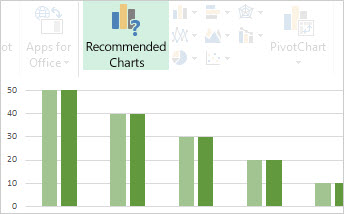
Quickly find the right chart type for your data, preview it in seconds and you're done. It's a really quick way to visually present data.
One Window Per Workbook
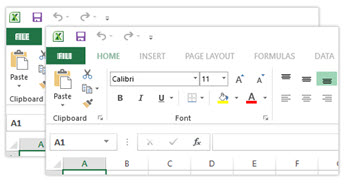
Ever wanted to work on multiple workbooks/spreadsheets at once, but found it frustrating that you have to switch between them? Problem solved - the new version has one window per spreadsheet.
PivotTable
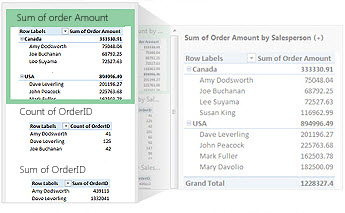
The Pivot table features have been improved, made easier to use and are better than ever. Excel now offers recommendations on ways to organise the data so it's faster than before. For more advanced uses there are Table Slices and PowerPivot features (you'll need Agility Desktop with Office Professional for these items)
Tour the rest of Office 2013 with Agility Desktop:
< Return to "Agility Desktop v2 - Get Prepared
<< Back to the Blog
<<


© Copyright 1998-2025, VPW Systems (UK) Ltd | All Rights Reserved | Legal Information |
IT Services and Computer Support for Small Business from an Exeter, Devon Based IT Support and Services Company
From IT Support Services to
Business Broadband, Server Systems and
Cloud Email, Cloud Desktop and
Web Hosting Services
Reg'd Office: St Paul's Business Centre, Newton Abbot, TQ12 2HP (NOTE: Visitors not permitted without prior arrrangement)
You're connecting to us as: 216.73.216.91 using IPv4